Forex Strategies
Using Moving Averages to your Advantage
 Moving averages are just about the commonest and also simplest aspect of technical analysis and studying price movement of a currency pair.
What an average does, is basically smooth out the movement of a currency over a period of time, giving you a good idea of whether there is a distinct uptrend or downtrend. Moving average is typically helpful when your fundamental analysis says one thing, and the charts, another.
When the price line on a chart seems to fluctuate quite a bit, or is choppy, a moving average gives a much 'smoother' line and shows you just the 'average' change across a period of time. With a smooth line, it is easier to spot a distinct downward movement or an upward movement.
Depending on what information you're looking for in your chart, you could use Simple Moving Average (SMA) or Exponential Moving Average (EVA).
SMA and EVA
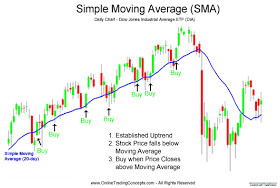
 SMA gives you a simple average – sum of all closing prices for a period divided by the period. Your charting software will do the calculations for you.
However, because the Simple Moving Average is Simple, it takes a simple view of everything and gives you the big picture. While tracking the price movement of a pair over 30 days, it doesn't pay attention to small price spikes or dips in between that may happen for a day or two.
Therefore, while SMA proves beneficial to 'safe' traders, who just want to ensure they don't lose their money, and don't mind missing out on the potential risk/profit of going by what may or may not seem like a new trend.
However, sometimes, the one day spikes and dips that occur during a month in a currency pair's movement are not just flukes, they may be indicators of a trend about to form. For instance, if you noticed a spike yesterday in a currency pair you were tracking, then an SMA of the last 10 days would just wipe out the effect.
Truth is, that spike may be a pointer to a trend – that's when you use exponential moving average – a method that lays emphasis on immediate movement of the currency. That's not to say that you cannot calculate EMA over a long period of time. Your software will be able to calculate both, SMA and EMA for the same period. However, the EMA will be a lot more responsive to the small dips and spikes and will represent minor changes better than the SMA.
The trick lies in understanding what kind of a trader YOU are, so that you can choose what average you want to go with. Many traders also plot SMA and EMA for various time periods on the same chart to get a better picture.


